Use case
Relevant apps:
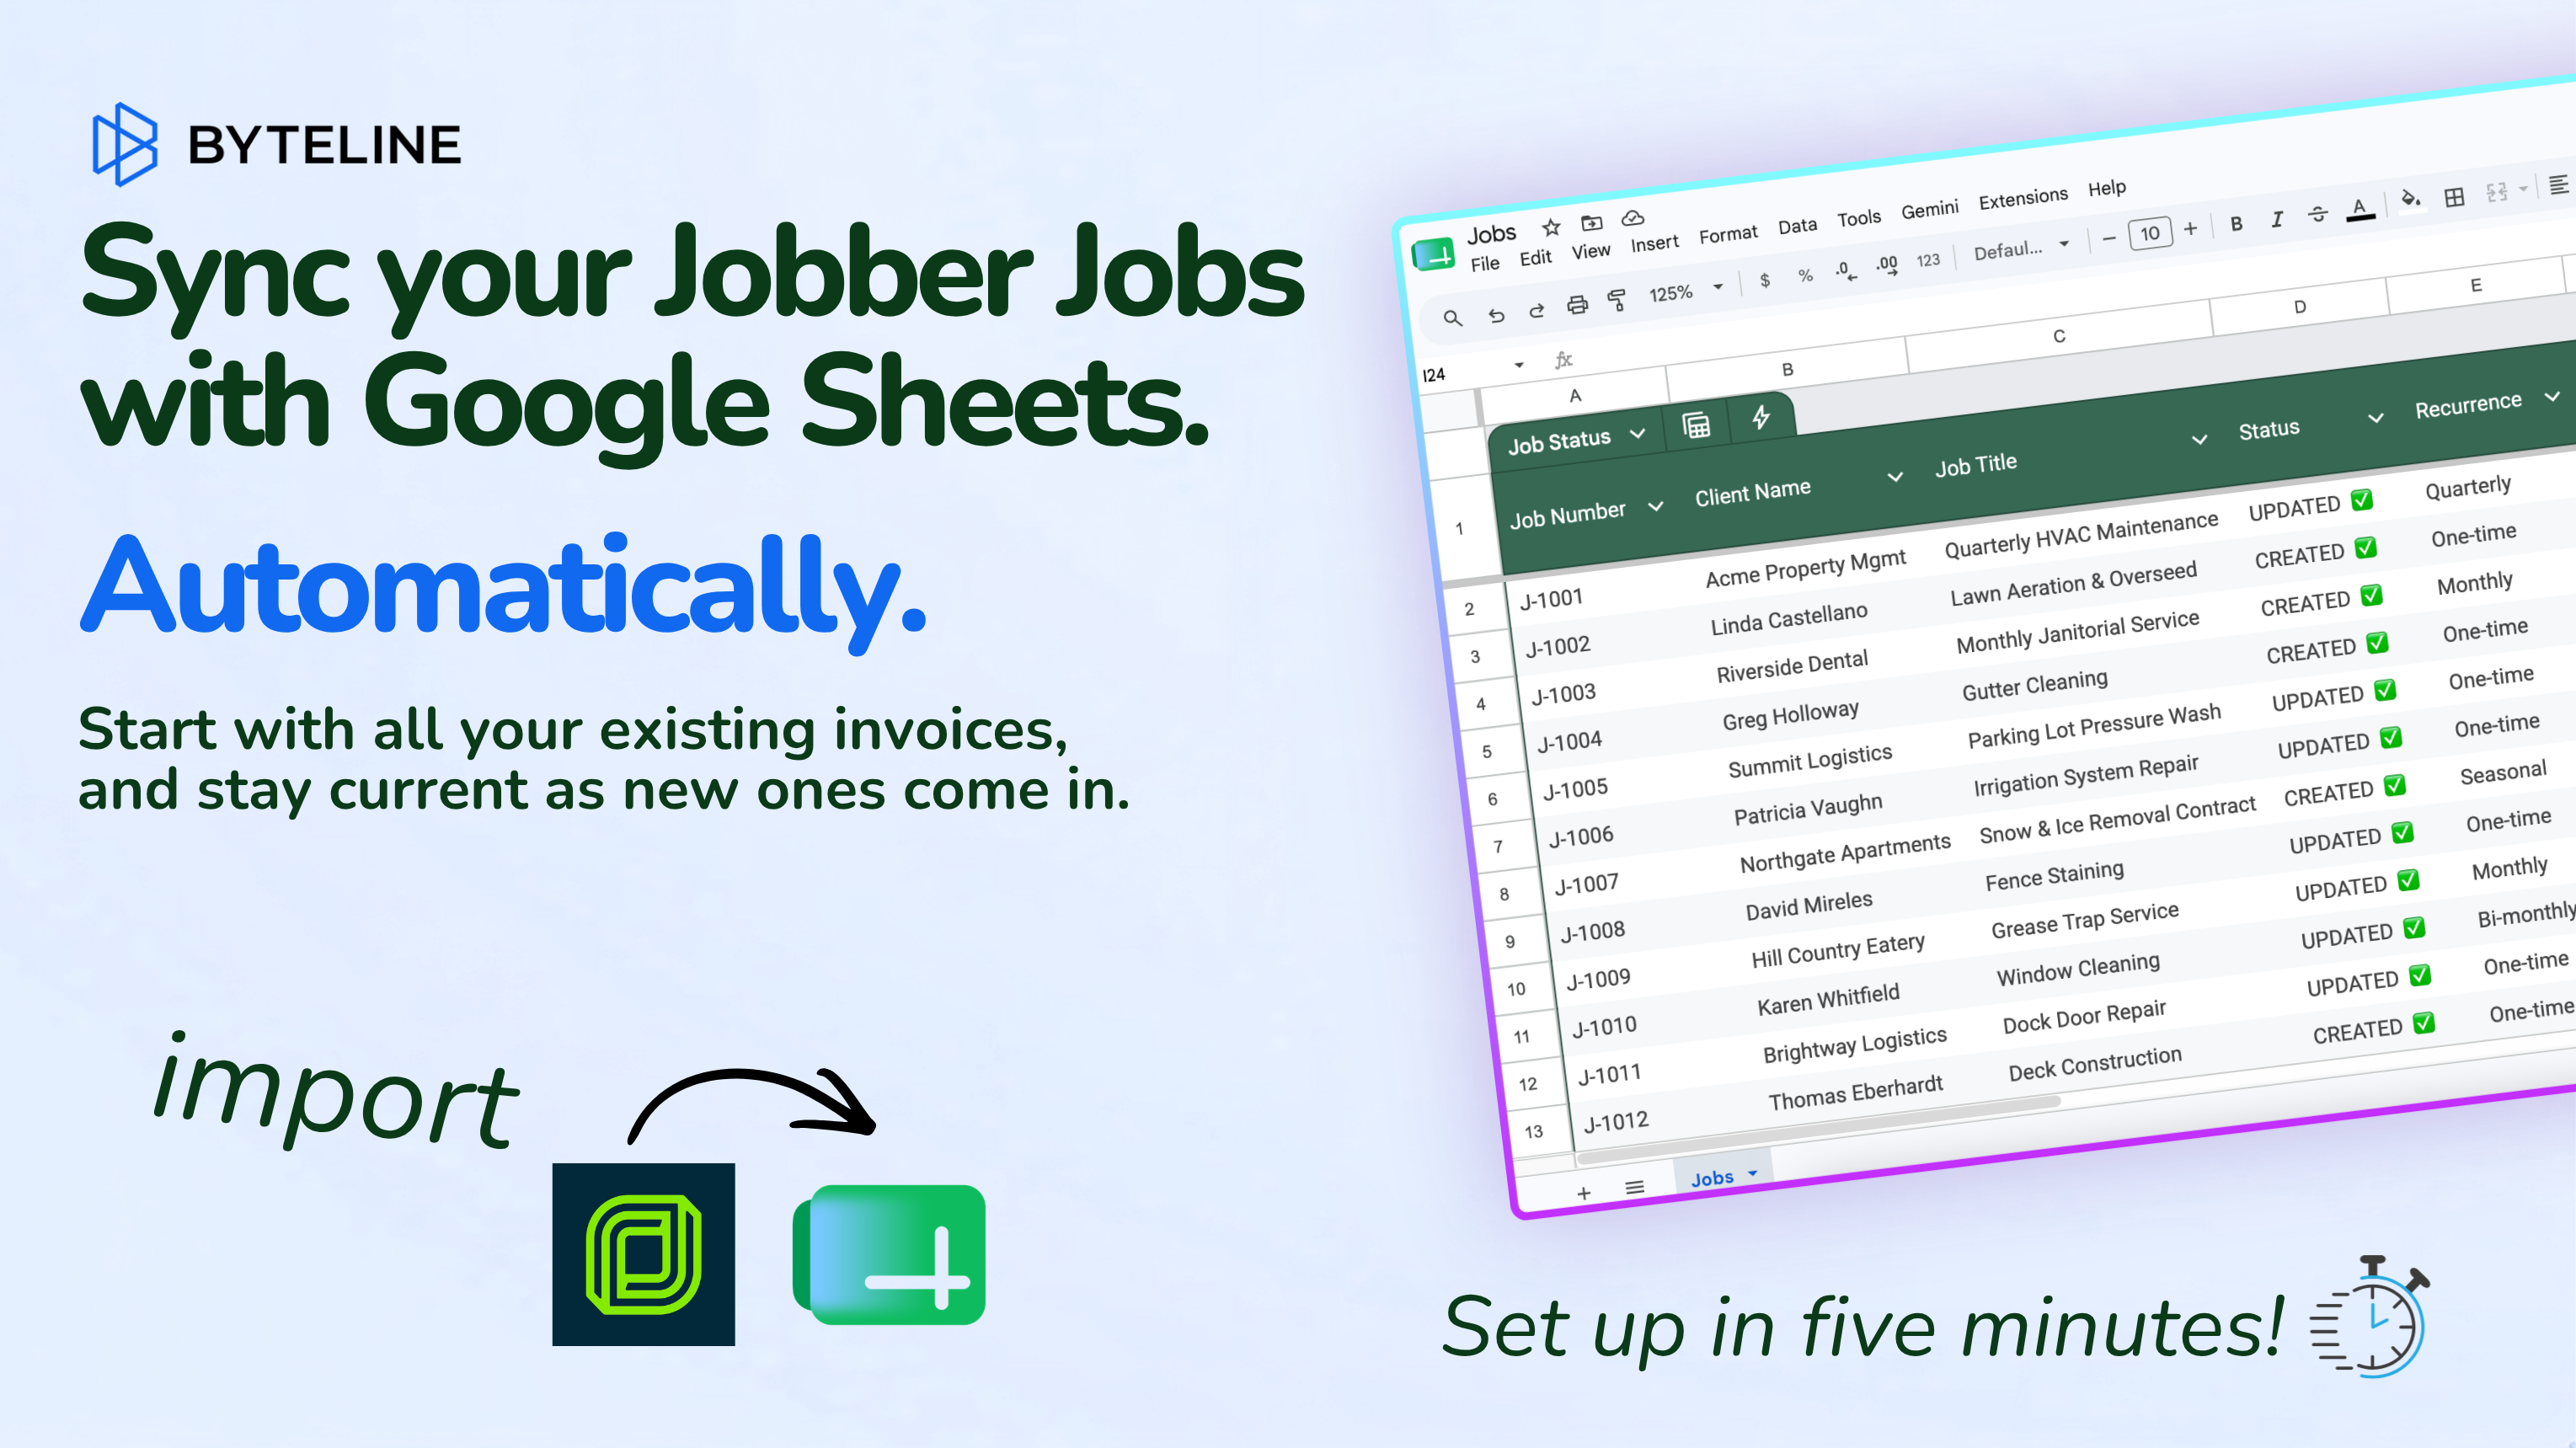
Jobber Jobs in Google Sheets: Set Up a Live Job Board, Then Build These 5 Reports
Jobber knows everything about your jobs — status, type, schedule, revenue, what’s been invoiced and what hasn’t. What it doesn’t do is let you slice that data your own way. The pivot table you want, the aging view your ops manager asked for, the uninvoiced-work number your bookkeeper keeps chasing — that’s spreadsheet territory.
This guide does two things. First, it gets every open job flowing into a Google Sheet automatically — a live job board that updates itself as jobs are created, changed, or closed in Jobber. Second — and this is the part most guides skip — it shows you exactly what to build once the data is there: five reports, with the formulas, that turn a raw job feed into answers.
If you want the full background on how Byteline’s Jobber sync works (and why it beats CSV exports and Zapier-style triggers), that’s covered in our complete Jobber → Google Sheets sync guide. This article assumes you’re sold on the idea and want the jobs-specific setup and payoff.
Part 1: The 10-minute setup, step by step
Byteline ships a prebuilt template for exactly this: Sync Jobber Jobs to Google Sheets (Open + Auto Sync). It pulls your existing open jobs into a Sheet (initial import), then keeps the Sheet updated automatically (one-way, Jobber → Sheets) as jobs change.
1. Start a sync at console.byteline.io. Choose Jobber as the first app and Google Sheets as the second.

Byteline new sync screen with Jobber and Google Sheets selected as the two apps
2. Pick the Jobs template. On the “Choose how to sync Jobber ↔︎ Google Sheets” screen, select Sync Jobber Jobs to Google Sheets (Open + Auto Sync) — you’ll see it tagged Initial import, Keeps updated, and One-way.

Byteline template picker with the Sync Jobber Jobs to Google Sheets template selected via the Use template button
3. Connect Jobber. Byteline confirms the template you picked and prompts a one-time Jobber authorization. Nothing syncs until you review and start the sync.

Byteline Connect Jobber screen showing the Sync Jobber Jobs to Google Sheets template selected before authorization
4. Connect Google and pick your Sheet. Authorize your Google account, then choose the destination spreadsheet and the specific sheet/tab the job rows should land in.
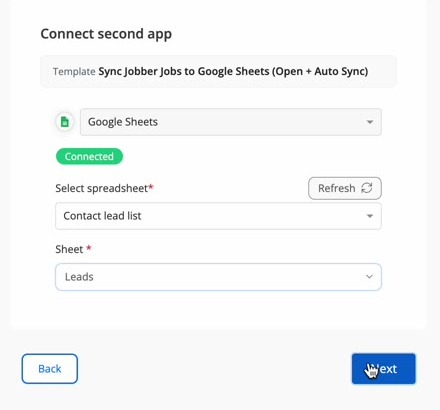
Byteline connect second app screen with Google Sheets connected, a spreadsheet selected, and the destination sheet tab chosen
5. Review the field mapping. Byteline analyzes both sides and auto-maps the job fields for you — status, type, revenue, uninvoiced total, schedule, property address, customer — and confirms with “All required fields are mapped.” Each Jobber source field is marked read-only with an arrow showing it flows into the matching Sheet column, so nothing in the Sheet ever writes back. Use Add mapping for extra fields or Fix mappings to adjust a pairing.

Byteline field mapping screen showing Jobber job fields auto-mapped to Google Sheets columns, with each Jobber source field marked read-only
6. Review and confirm. The Sync Progress and Review screen summarizes the whole setup — direction (Historical: Jobber → Google Sheets; Ongoing: Jobber → Google Sheets, labeled “Existing Data and Future Changes”), the connected apps, and the table and field mappings — and generates a preview so you see the result before anything goes live.
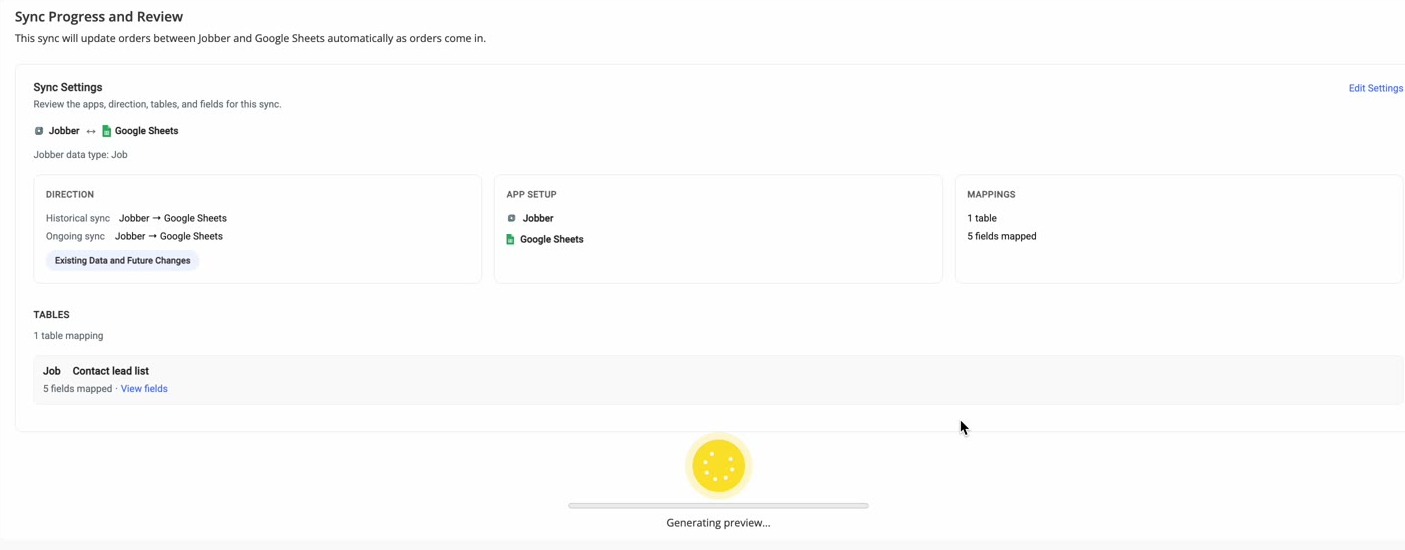
Byteline Sync Progress and Review screen summarizing direction, connected apps, and table and field mappings before going live
7. Go live. Turn the sync on. Byteline runs the historical backfill of your open jobs first, then keeps watching Jobber for changes. From the sync dashboard you can toggle it Live, trigger a manual check, and view the record change history — what was created, updated, or deleted on each side.

Byteline confirmation that the historical data sync completed successfully and the sync is now live and actively syncing changes
That’s the whole setup. The columns you now have in Sheets — Job ID, Job Status, Job Type, Total Revenue, Uninvoiced Total, Start/End Time, City, and more — are the raw material for everything below.
Part 2: Five reports your live job board unlocks
These assume your jobs land on a tab named Jobs with headers in row 1. Adjust column letters to match your mapping.
1. Revenue by job type
The question every owner asks first: which kind of work actually makes the money?
=QUERY(Jobs!A:Z, 'select E, sum(F) where E is not null group by E order by sum(F) desc label sum(F) 'Revenue'')Where E is Job Type and F is Total Revenue. One formula, a ranked table, and it re-ranks itself as new jobs sync in.
2. Uninvoiced work backlog
Money you’ve earned but haven’t billed. Sum the Uninvoiced Total column and break it out by status:
=SUMIF(Jobs!B:B, 'Completed', Jobs!G:G)Where B is Job Status and G is Uninvoiced Total. Completed-but-uninvoiced is the number to drive your billing day. Because the sync updates rows in place, this figure drops in near real time as invoices go out in Jobber.
3. Open jobs aging
How long has each open job been sitting? Add a helper column:
=IF(B2='Open', TODAY()-J2, '')Where J is the job’s start date. Wrap it in a pivot (Rows: Job Type, Values: AVERAGE of age) and you’ve got an aging view per service line — the report that surfaces stuck work before a customer calls about it.
4. Monthly revenue trend
Insert → Pivot table on the synced tab. Rows: Start Date (grouped by month). Values: SUM of Total Revenue. That’s your seasonality curve — useful for staffing and for spotting a soft month while there’s still time to fill it.
5. Jobs by territory
Group by the synced City (or ZIP) column to see where the work concentrates:
=QUERY(Jobs!A:Z, 'select M, count(A), sum(F) group by M order by count(A) desc label count(A) 'Jobs', sum(F) 'Revenue'')Where M is City. Routing crews, planning where to advertise, deciding whether a territory is worth the drive — it all starts with this table.
Why this only works with a true sync
Every report above depends on one thing: the Sheet being a mirror of Jobber, not a log. A trigger-based automation appends a row when a job is created — but when the job’s status changes or revenue is updated, your report is now wrong. Byteline tracks each record, so an updated job updates its existing row, and your formulas stay true without maintenance. (The full comparison against CSV exports and trigger tools is in the main guide.)
Need your billing data alongside the jobs? Pair this with the Jobber invoices sync. Want a current customer list for outreach? That’s the Jobber clients sync.
FAQ
Does the Jobs template include closed jobs?
The Open + Auto Sync template imports open jobs and keeps syncing as jobs change — including status changes. If you need a different scope, use Start from Scratch to define your own filters.
Can my team edit the Sheet?
They can add their own columns (notes, assignments, checkboxes) — those live only in Sheets. The synced columns are one-way from Jobber and read-only on the Jobber side, so a stray edit can’t corrupt your Jobber data.
Will my formulas break when new rows sync in?
Use full-column ranges (Jobs!F:F) rather than fixed ranges (Jobs!F2:F50) and your reports pick up new jobs automatically.
Set it up once, and the job board — and every report built on it — stays current on its own.
👉 Try Byteline for free and have your live job board running today.

.png)
.png)